前言
本文介绍如何使用 d3js 创建一个 bar chart 组件(参考下视频), 下面操起来!
but why?
为什么要使用 d3 自己做图表组件呢?现在不是有很多 JS 组件库了吗?
我试着从以下几个原因来说明这个问题:
- 图表库太多不知道选用哪个
- 有的图表好看,但只支持基本功能,定制能力很差
- 有的图表要求收费,否则显示图表 logo
- 费了好多时间找的一个图表库,可是有几个小的交互功能不支持,比如图例不能自定义或不能支持范围选取
图表没有“银弹”
越来越发现“没有银弹”是具有普适性的。
包含可视化的项目中,对图表的使用和依赖程度是不一样的。如果一个数据可视化项目要求比较简单,如:只使用了柱图,饼图,拆线图,且只需要图表的展示并不需要图表交互的话。可能世面上的大多数图表都是适用的。但我认为,这类项目不应该算叫数据可视化项目,就是在一个系统中集成了一些简单数据分析的功能。
如果是向天平的另一端看的话,想找到一个能够范围所有项目在数据分析领域的图表库的话,是很难的。一个原因大于这些图表库通过封装而提高了使用的便利性的同时,也损失掉了灵活性。虽然没个图表库都试图开发更多的配置接口,但有时也不如人意。
找一个能够完全满足项目需求的图表库太难
图表开发的时候会有几个问题经常遇到:
- 可以支持多数据系列
- 支持时间序列
- 可以切换数据的可见性,通过图表或图表中的 series
- 调整图表样式,如设置图表调色板,线条粗细等等
- 事件的处理,如点击图例,点击数据,范围选取数据
- 自定义 hover 文本
- 动画
- 多 y 轴
- 数据加载性能
- 自定义图表
- …
笔者不定周期的会审查一下市面上的图表库,目前没有得到一个使自己完全满意的。
d3js 定制能力非常强大
d3js 与其它图表的不同在于它开放给用户的是显示组件,而不是一个个已经封装好的图表。并且每个抽象的显示组件都可以进行编程式的定制。如:Axis, GridLine, Title, Series。从这一点上,d3js 所能做的可能会超越你的想象。我觉得也可以说 d3js 和其它的图表库不是一个使用级别上的东西。所以,也不太好与之相比较。
所以
我个人建议,如果是一个对数据可视化有一定要求的项目,就直接用 d3js DIY 组件好了,可能提供给你充足的灵活性和想象力。这样不会因为三方库不得不进行功能上的妥协。
准备
工程搭建
首先,需要搭建最小项目框架,包括:
- 配置基础
- 配置 webpack-dev-server 和 sourcemap
- 配置 typescript
过程参考 webpack 教程就好。
测试数据
测试数据使用 faker 进行生成
!!!!这个地址一会要换成 tag testdata
完整代码
显示
接下来,开始画 Bar Chart 了。
Axis
我们要画的是一个 horizontal bar chart。所以 Y 轴的对数是 categorial 的,而 X 轴的数据是 number。
X 轴要使用 scaleLinear, 而 Y 轴要使用 scaleBand。
主要代码
1
2
3
4
5
6
7
8
9
10
11
12
13
14
15
16
17
18
19
20
21
22
23
24
25
26
| protected initAxis() {
const { data, width, height, margin } = this.config
const maxDomainValue = d3.max(data, (d: DataItem) => d.x as number)
this.x = d3
.scaleLinear()
.domain([0, maxDomainValue])
.range([margin.left, width - margin.right])
this.xAxis = d3.axisBottom(this.x)
this.svg
.append('g')
.attr('transform', `translate(0, ${height - margin.bottom})`)
.call(this.xAxis)
this.y = d3
.scaleBand()
.domain(data.map((d: DataItem) => d.y) as string[])
.range([margin.top, height - margin.bottom])
.padding(0.3)
this.yAxis = d3.axisLeft(this.y)
this.svg
.append('g')
.attr('transform', `translate(${margin.left}, 0)`)
.call(this.yAxis)
}
|
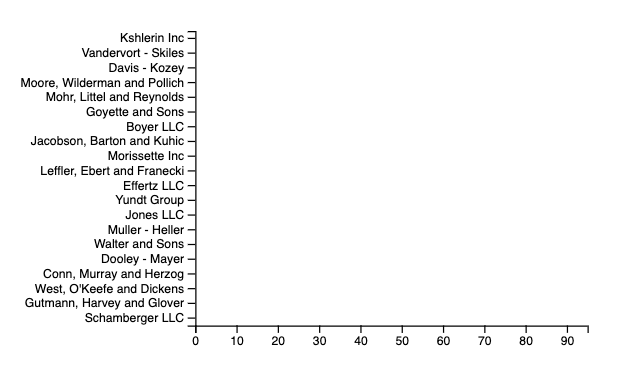
显示效果如下
Series
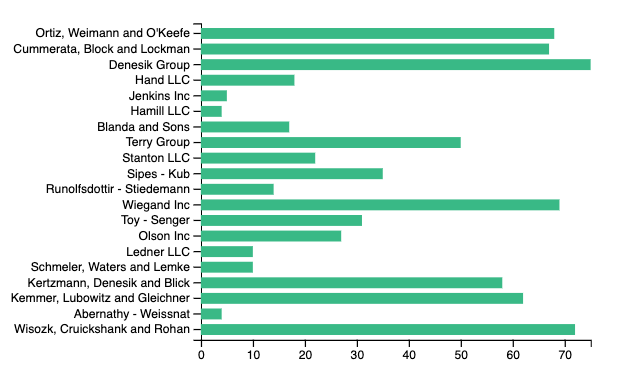
然后是主角登录,画 Series,当前我们的用例中不包含多 Series 的情况,所以只需要画一个 bar 就行了。
在 SVG 中可以使用 rect 来实现。
1
2
3
4
5
6
7
8
9
10
11
12
13
14
| protected initSeries() {
const { data, margin } = this.config
this.svg
.selectAll('.bar')
.data(data)
.enter()
.append('rect')
.classed('bar', true)
.attr('fill', Colors.primary)
.attr('x', margin.left)
.attr('y', (d: DataItem) => this.y(d.y))
.attr('width', (d: DataItem) => this.x(d.x) - margin.left)
.attr('height', this.y.bandwidth())
}
|
bandwidth() 可以取得 scaleBand 中计算出来的 band 宽度。显示效果如下
Grid Line
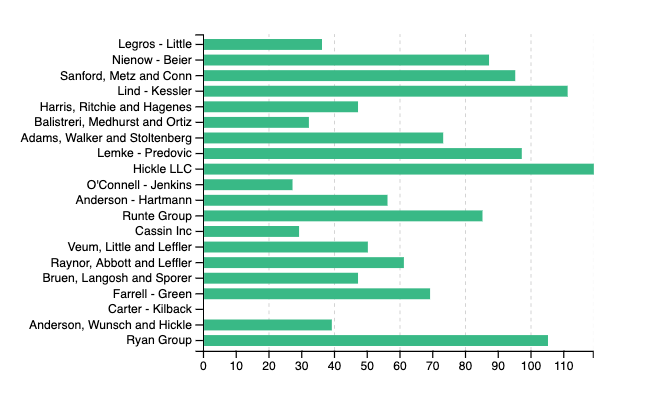
加网线的方法可以参考这个例子
grid line 实际上就是一个 axis。在些基础上需要注意几点:
- tickFormat 设置成’’
- 设置 ticks(interval)
- 设置下样式
- 在 series 和 axis 的图层下方进行绘制
- x/y 轴是否都需要加 grid line 适具体情况而定
主要代码参考如下
1
2
3
4
5
6
7
8
9
10
11
12
13
14
15
16
| protected initGridlines() {
const { height, margin } = this.config
const gridX = d3
.axisBottom(this.x)
.ticks(5)
.tickSize(-height + margin.top + margin.bottom)
.tickFormat(() => '')
this.svg
.append('g')
.call(gridX)
.classed('grid', true)
.attr('color', Colors.grey)
.attr('stroke-width', 0.1)
.attr('stroke-dasharray', '3,3')
.attr('transform', `translate(0, ${height - margin.bottom})`)
}
|
Mid Line
通过上面的努力已经完成了一个静态 bar chart。如果不需要任何交互的话,这个图表已经是可以在项目中使用的了。
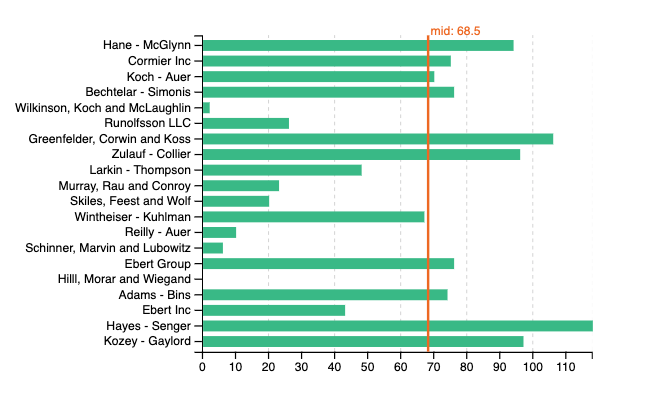
有时,为了提供数据分析的效率,会在些基础上绘制一些辅助线,比如:中位数线。
中线主要有几个点注意下就可以了:
- 使用
d3.median()计算中位数,d3 也提供了其它基础的统计方法,如四分位数和平均数等
- 在 svg 画一个 line, 显示中位数线
- 在 svg 画一个 text, 显示数值
1
2
3
4
5
6
7
8
9
10
11
12
13
14
15
16
17
18
19
20
21
22
23
24
25
26
27
| protected initMidLine() {
const { data, margin, height } = this.config
const midValue = d3.median(data.map((d: DataItem) => d.x as number))
this.svg
.append('line')
.classed('mid', true)
.attr('stroke', Colors.secondary)
.attr('stroke-width', 2)
.attr('x1', this.x(midValue))
.attr('x2', this.x(midValue))
.attr('y1', margin.top)
.attr('y2', height - margin.bottom)
this.svg
.append('text')
.classed('mid-text', true)
.attr('x', this.x(midValue) + 2)
.attr('y', margin.top)
.attr('width', 20)
.attr('height', 10)
.attr('font-size', '10px')
.attr('font-family', 'sans-serif')
.style('fill', Colors.secondary)
.text(`mid: ${midValue}`)
}
|
Responsive
有一个隐性需求是图表经常要自适应屏幕的大小。svg 可能通过以下代码实现在 block 容器中自适应大小,并且可以根据屏幕尺寸的改变而自动按比例进行缩放。
1
2
3
4
5
6
7
8
9
10
11
12
13
14
15
16
17
18
19
20
21
22
23
| protected initSvg() {
const { selector, width, height } = this.config
this.svg = d3
.select(selector)
.append('div')
.classed('chart-wrapper', true)
.style('display', 'inline-block')
.style('position', 'relative')
.style('width', '100%')
.style('padding-bottom', '100%')
.style('vertical-align', 'top')
.style('overflow', 'hidden')
.append('svg')
.attr('preserveAspectRatio', 'xMinYMin meet')
.attr('viewBox', `0 0 ${width} ${height}`)
.style('display', 'inline-block')
.style('position', 'absolute')
.style('top', '0')
.style('left', '0')
}
|
交互
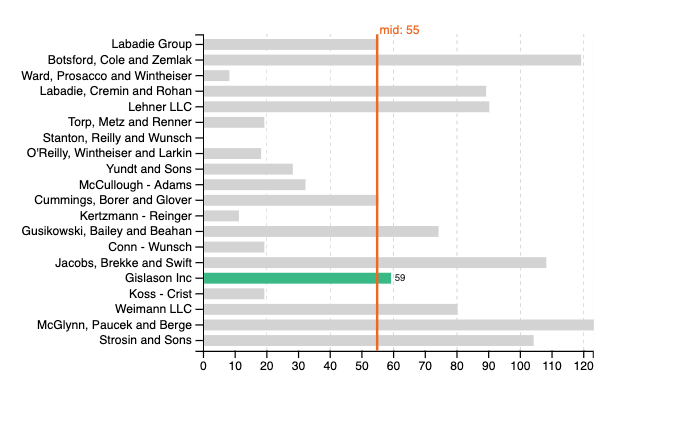
通过 d3js 可以很方便的实现想要的交互功能。在这里我们实现最常用的几个 bar chart 的交互:
- 鼠标悬停在数据上进行高亮,并显示 tooltip 数值
- 点击事件
使用on进行事件监听,click 事件用来响应点击。hover 的处理包含进入和退出需要监听 mouseover 和 mouseout。另外,hover 的处理要加上 animation,不然的话状态切换会有些生硬。修改后的initSeries如下
1
2
3
4
5
6
7
8
9
10
11
12
13
14
15
16
17
18
19
20
21
22
23
24
25
26
27
28
29
30
31
32
33
34
35
36
37
38
39
40
41
42
43
44
45
46
47
48
49
50
51
52
53
| protected initSeries() {
const { data, margin } = this.config
const that = this
this.series = this.svg
.selectAll('.bar')
.data(data)
.enter()
.append('rect')
.classed('bar', true)
.attr('fill', Colors.primary)
.attr('x', margin.left + 1)
.attr('y', (d: DataItem) => this.y(d.y))
.attr('width', (d: DataItem) => this.x(d.x) - margin.left)
.attr('height', this.y.bandwidth())
.on('click', (d: DataItem) => alert(`click ${d.y}`))
.on('mouseover.bar', function(d: DataItem, i: number) {
that.setSeriesColor(Colors.grey)
d3.select(this)
.transition()
.duration(200)
.attr('fill', Colors.primary)
that.seriesLabel
.filter((d: DataItem, index: number) => index === i)
.transition()
.duration(200)
.attr('opacity', 0.9)
})
.on('mouseout.bar', function(d: DataItem, i: number) {
that.setSeriesColor(Colors.primary)
that.seriesLabel
.transition()
.duration(200)
.attr('opacity', 0)
})
this.seriesLabel = this.svg
.selectAll('.series-label')
.data(data)
.enter()
.append('text')
.classed('series-label', true)
.text((d: DataItem) => d.x)
.attr('fill', Colors.text)
.attr('x', (d: DataItem) => this.x(d.x) + 4)
.attr('y', (d: DataItem) => this.y(d.y) + this.y.bandwidth() / 2)
.attr('width', (d: DataItem) => this.x(d.x) - margin.left)
.attr('dominant-baseline', 'central')
.attr('height', this.y.bandwidth())
.attr('font-size', '8px')
.attr('font-family', 'sans-serif')
.attr('opacity', 0)
}
|
组件化
最好一步,把一些可重用的配置抽取出来,一个图表组件就可能在项目中使用了。
1
2
3
4
5
6
7
8
9
10
11
12
| new BarChart({
selector: '#chart-1',
data: testdata.data1(),
showMidLine: false,
margin: {
bottom: 20,
left: 200,
top: 20,
right: 20
},
onClick: d => {}
})
|


